Illustrative example: Zorelo
Own-site revenue tripled in eight months, without a single discount.
These fictional projects show how a marketing project could be presented. The brands, people, quotes, artwork and results are invented; they are not evidence of client work or promised outcomes.

Where things stood.
Zorelo sold almost entirely through Instagram DMs and a marketplace storefront. Own-site revenue had been flat for two years while ad spend grew 40%, and nobody could say which half of the budget was working.
The ask was blunt: make the website the main sales channel within a year, without discounting the product.
What the audit found
3 weeks, 41 pages- Invisible category pagesNone of the 40 collection pages had indexable titles or structured data. 78% of category demand landed on two competitor domains.
- Checkout lost 6 in 10 buyersMandatory account creation, no delivery estimate before payment, and a single payment method.
- Paid budget bought its own name61% of spend went to brand terms the organic listing already owned.
Three steps, in order.
A proposed plan within this fictional project.
- 01Weeks 1 to 6
Rebuild the collection pages
We rewrote 40 collection pages around what people actually search for, with schema, filters and internal links from the editorial pages.
- 02Weeks 4 to 9
Two-step guest checkout
We moved the delivery estimate and payment options above the fold, made the account optional, and added Apple Pay and instalments.
- 03Weeks 7 to 32
Move budget to new customers
We cut spend on brand terms to a defensive minimum and moved the difference into broad-match search and Meta prospecting.
The work itself.



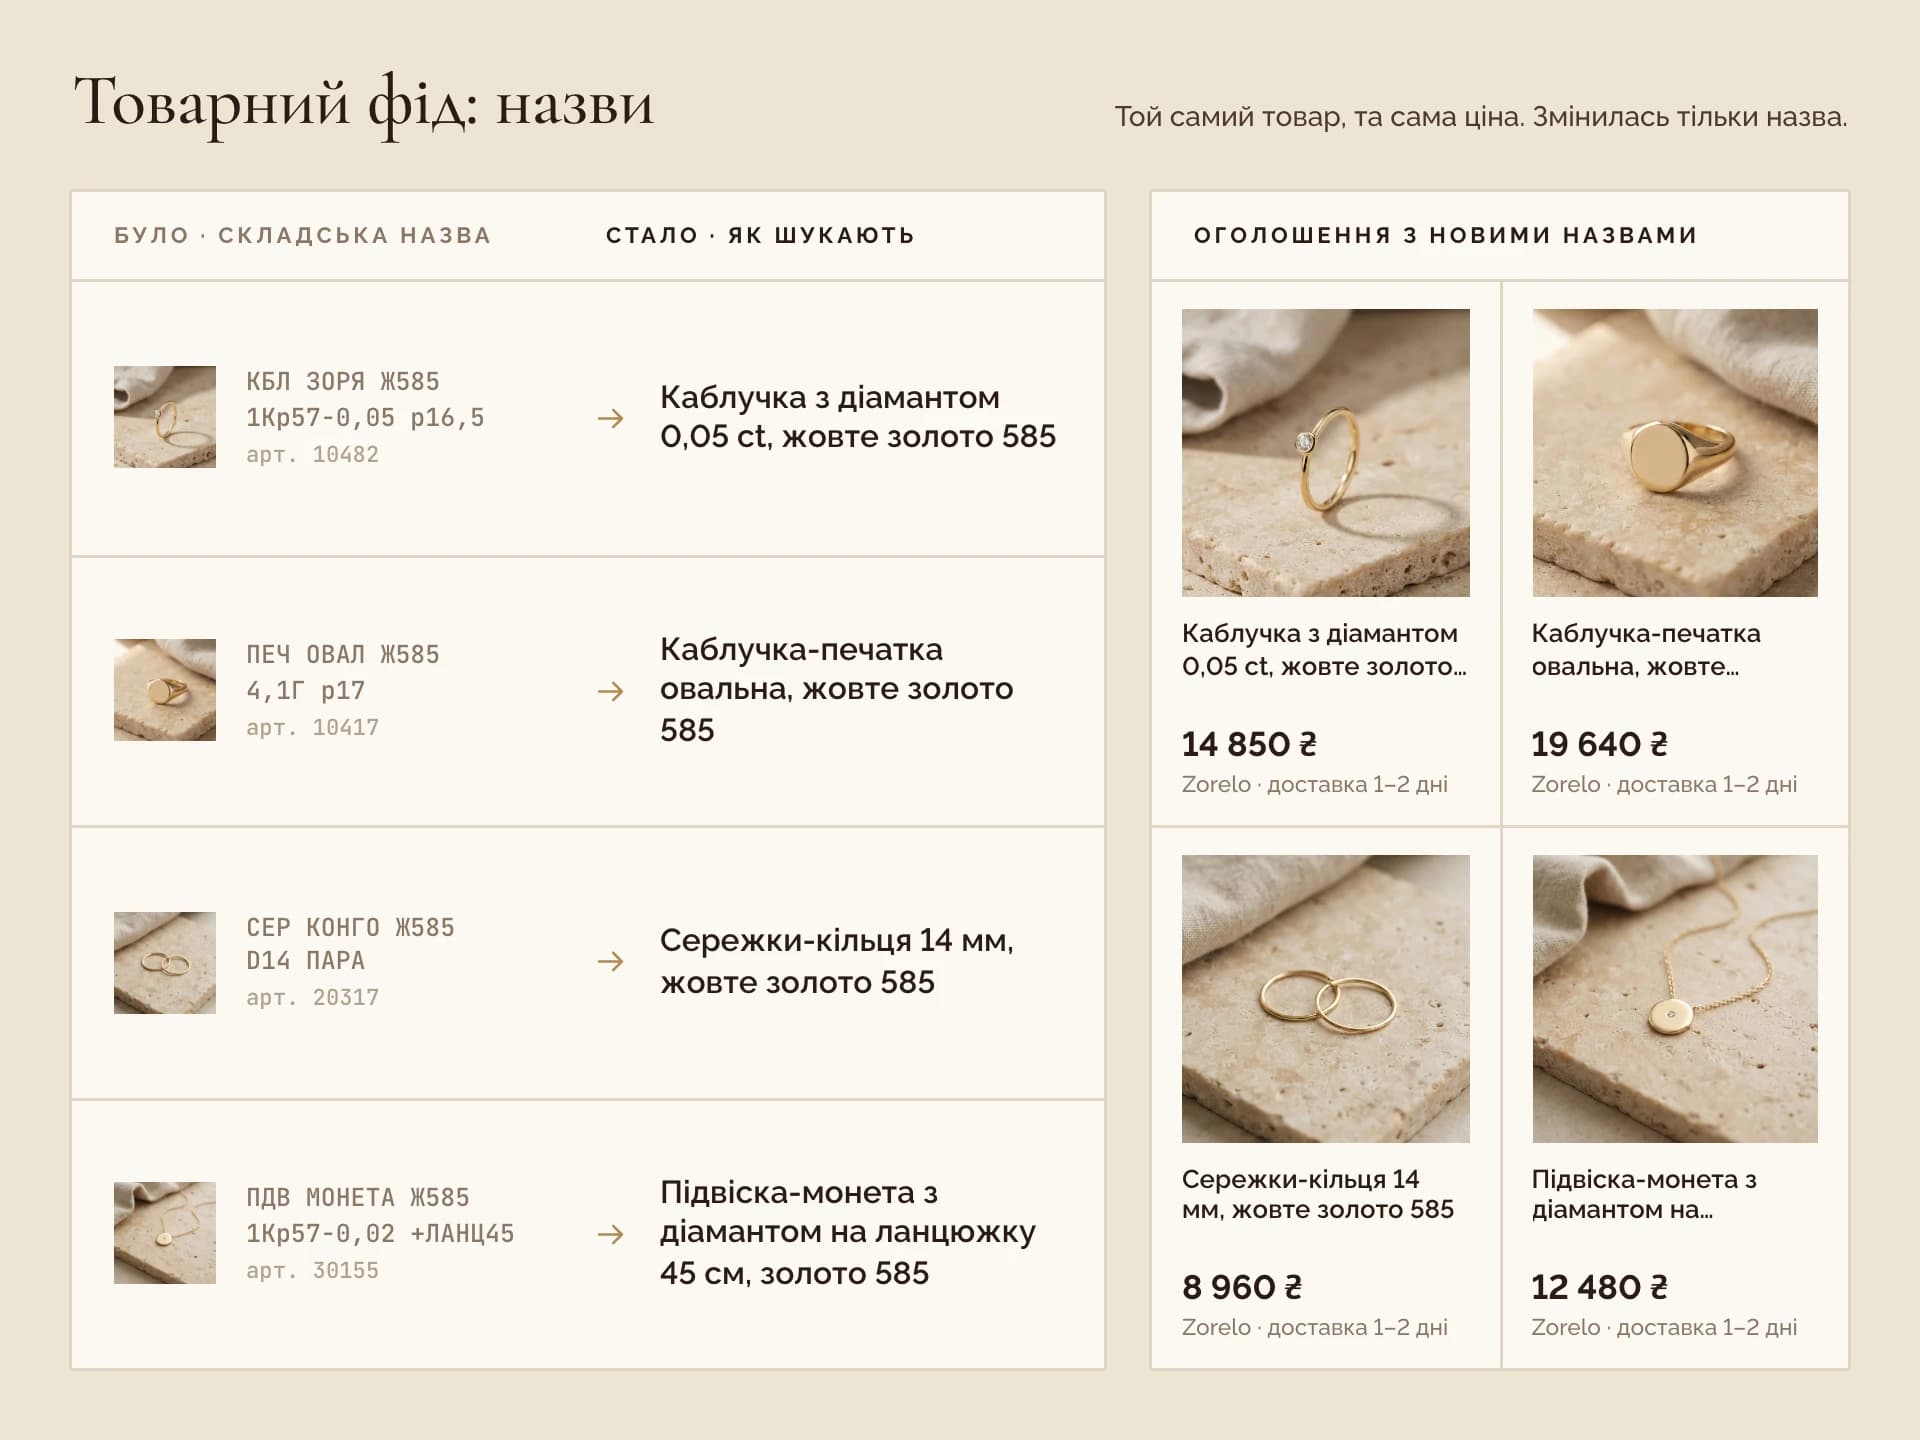
What changed, and by how much.
Illustrative figures
They killed two of our best-performing-on-paper campaigns in week three. Revenue went up. That told me everything about how they read data.
What we’d do differently.
Illustrative exampleWe rebuilt all forty collection pages before measuring. Ten would have proved the model three weeks earlier and saved the client a month of ad spend on pages we later changed anyway.
A lesson explored in this fictional scenario.


Choose the number you want to improve.
Have a similar challenge? Tell us about your project and the result you want.